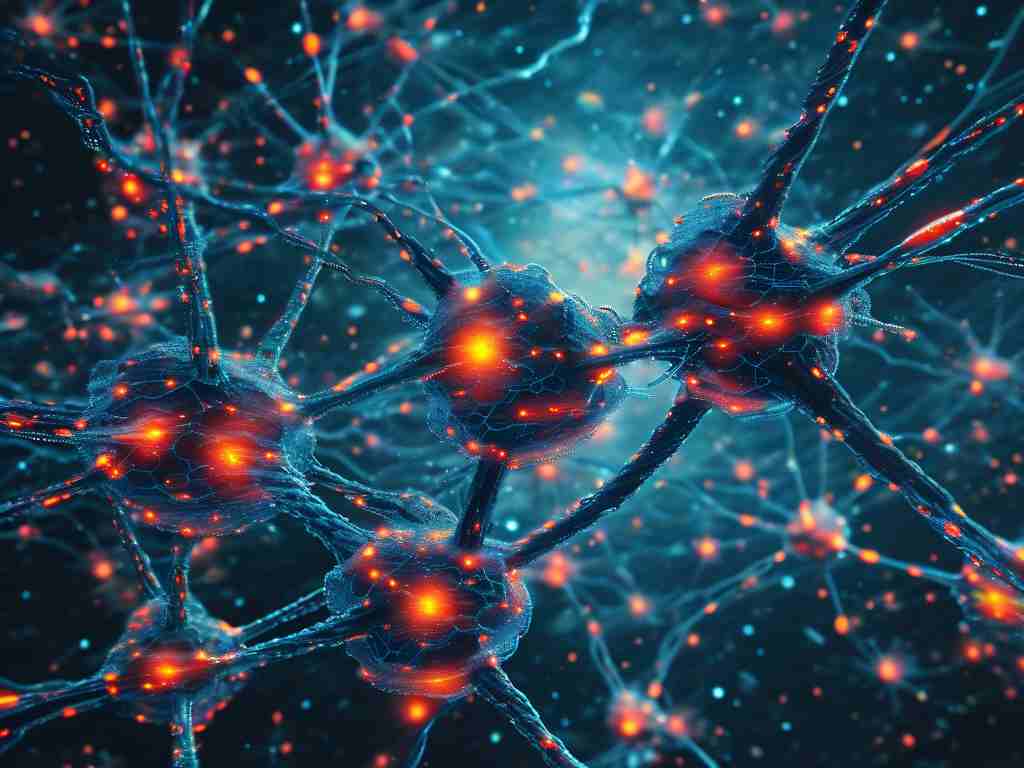
In the rapidly evolving field of artificial intelligence, neural network diagrams serve as critical visual tools for both beginners and experts. These schematic representations decode the complexity of AI models, transforming abstract mathematical operations into accessible visuals. This article explores how to interpret and create neural network diagrams while highlighting their practical applications across industries.

The Anatomy of a Neural Network Diagram
A standard neural network diagram comprises three primary components: input layers, hidden layers, and output layers. Input nodes typically appear on the left, representing raw data such as pixel values in images or word embeddings in text. Hidden layers—often depicted as vertical columns—contain interconnected neurons that apply activation functions like ReLU or Sigmoid. Arrows between layers symbolize weight matrices governing data transformation.
For instance, a convolutional neural network (CNN) diagram might include specialized layers like pooling regions visualized as grid-reduction modules. Code snippets in frameworks like TensorFlow or PyTorch often align with these diagrams:
model = tf.keras.Sequential([
    tf.keras.layers.Conv2D(32, (3,3), activation='relu', input_shape=(28,28,1)),
    tf.keras.layers.MaxPooling2D((2,2)),
    tf.keras.layers.Flatten(),
    tf.keras.layers.Dense(10, activation='softmax')
])
Interpreting Diagram Variations
Not all neural network diagrams follow the same conventions. Recurrent neural networks (RNNs) introduce loop structures to represent memory cells, while transformer models use attention mechanism blocks shown as multi-headed arrow clusters. Generative adversarial networks (GANs) often display dual competing architectures with generator-discriminator interactions.
A common pitfall occurs when diagrams oversimplify skip connections or normalization layers. For example, ResNet's "shortcut" connections should appear as parallel pathways bypassing multiple layers rather than single-line jumps.
Practical Applications of Visualization
- Educational Contexts: Diagrams help students grasp backpropagation dynamics by mapping gradient flow through computational graphs.
- Model Debugging: Visualization tools like TensorBoard use layered diagrams to identify vanishing gradient issues in deep networks.
- Industrial Deployment: System architects rely on component diagrams to optimize hardware resource allocation for AI inference tasks.
Creating Effective Diagrams
Professional tools like Draw.io, Lucidchart, and specialized Python libraries (e.g., PlotNeuralNet) enable precise diagramming. Best practices include:
- Color-coding activation patterns (e.g., red for high values, blue for negative outputs)
- Annotating layer dimensions (e.g., "Conv1: 64 filters @ 3x3")
- Using dashed lines for dropout layers and shaded regions for batch normalization
A well-constructed diagram might resemble this lightweight PyTorch model:
class SimpleNN(nn.Module):
    def __init__(self):
        super().__init__()
        self.fc1 = nn.Linear(784, 128)
        self.dropout = nn.Dropout(0.2)
        self.fc2 = nn.Linear(128, 10)

    def forward(self, x):
        x = torch.relu(self.fc1(x))
        x = self.dropout(x)
        return torch.softmax(self.fc2(x), dim=1)
The Future of Neural Network Visualization
Emerging techniques include 3D interactive diagrams for spatiotemporal networks and augmented reality interfaces for collaborative model design. Recent research papers increasingly incorporate dynamic diagrams showing real-time training progression through loss landscapes and weight distribution heatmaps.
Common Misconceptions
- Myth: Complex diagrams indicate superior model performance
Reality: Overly intricate visuals often obscure functional clarity - Myth: All neurons operate independently
Reality: Diagram connections emphasize parameter sharing and dependency chains
As AI systems grow more sophisticated, the ability to translate mathematical models into intelligible diagrams becomes paramount. These visual tools not only accelerate knowledge transfer but also foster interdisciplinary collaboration between data scientists, engineers, and business stakeholders.

